You Set the Goal.
Loopra Delivers the Uplift.

End-to-end fixed ops solutions — from uncovering the best labor and parts grids to coaching advisors, stopping RO leaks in real time, recovering warranty revenue, filing cleaner claims, and asking an agent what to change next.

$1M+ annual uplift potential $700K+ avg warranty increase Submission-ready claims Ask Loopra Agent

From Goal to Captured Revenue

Set your uplift targets. Loopra agents build the grids, coach the team, and protect every RO — so the goal becomes daily operations.

STEP 1

Set Your Goal

Pick the uplift targets you want to hit — labor rate, parts markup, and revenue goals for the store or group.

Labor rate +$15/hr Parts markup +25%
STEP 2

Agents at Work

Build the best grids, spot advisors who drift from the goal, and monitor every RO in real time to stop leaks before close.

STEP 3

Uplift Revenue

Projected and proven outcomes on your own RO history — customer-pay labor, parts, and warranty reimbursement.

$1M+ annual revenue uplift

Six Solutions. One Fixed Ops Stack.

Live products dealers already run — the skills behind Loopra Agent, and the day-to-day tools that move ELR, parts markup, warranty recovery, and claim submission quality.

Dashboards Tell You What Happened. Loopra Tells You What to Change.

An AI agent for dealership service and parts. Ask Loopra anything about your store — it reasons across live and historical repair orders to find the root cause, the right place to intervene, and the dollar impact, then keeps looking for the next opportunity.

  • Skills forged in real dealerships — co-designed, shipped, and refined on live ROs
  • Agentic architecture built for Fixed Ops — domain knowledge embedded in how it reasons and acts
  • Not an LLM wrapped around dealership data — purpose-built workflows and specialized skills
  • Built on products dealers already pay for: Live RO Dashboard, Warranty Rate Increase, Labor & Parts Matrix Tuning, Advisor Score Card, Warranty Submission Tooling
$5M+ warranty opportunity identified
Ask It on Your ROs
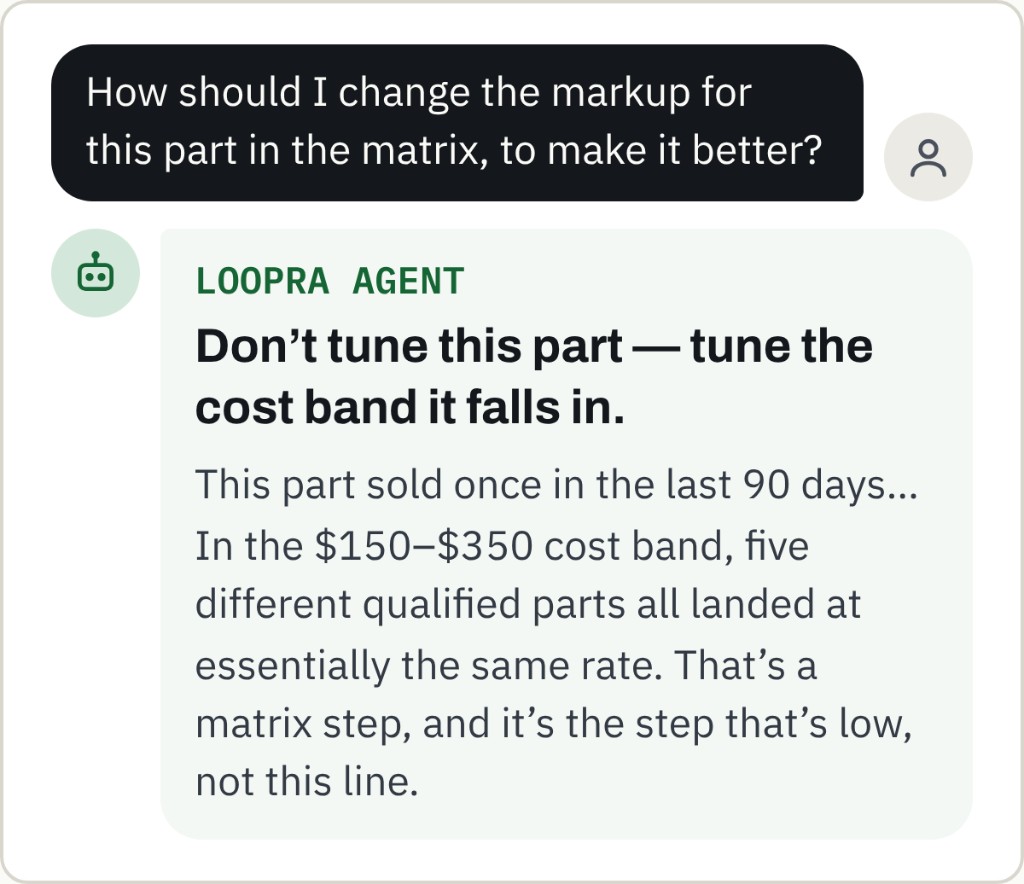
Loopra Agent recommending a matrix cost-band markup change

Where Dashboards Stop, Loopra Agent Keeps Going

Dashboard What happened

…and stops.

1 Why it happened

Root cause, not just a chart.

2 Where to intervene

The right lever for the store.

3 Proof from your data

Benchmarked on your ROs.

4 Simulated $ impact

What the change is worth.

5 The next opportunity

Keeps looking, unasked.
Two Conversations. Two Decisions a Dashboard Would Miss.

EXAMPLE 1 · REVENUE OPTIMIZATION

“How was the non-routine parts selling today?”

  1. Found the root cause — a 66% markup was a matrix-policy issue, not an advisor error.
  2. Picked the right lever — tune the $150–$350 cost band, not one part.
  3. Proved it with the dealer’s own data — similar parts already sell at 89.6%–100%.
  4. Quantified it — and flagged the trap if discounts eat the gain.
  5. Found more, unasked — underpriced reman parts costing ~5.6 pts of qualified markup.
~$400/mo added gross profit Back-tested on the last 90 days — ~3× the impact of what was asked, found unprompted
EXAMPLE 2 · CONTEXT-AWARE COACHING

“Which advisor needs performance improvement?”

Weighing ELR, parts markup, RO volume, and grid performance, Loopra named the highest loss per RO — then one constraint changed the answer.

  • New #1 coaching priority — heaviest labor discounting on non-routine work, dollars below the labor grid.
  • Coach the right work — the first pick beat the store on non-routine; the gap was in routine.
  • Hidden parts-pricing gap — advisor well below store average parts markup vs matrix.
  • People vs process — discounting below grid was shop-wide across 12 advisors, so it’s a process fix.
Coach the right person on the right work Separated individual coaching from store-wide process issues

Stop Guessing Your Pricing Grid

Generate the best, most customer-friendly labor rates and parts markups from your RO history — then tune any billed-hour rate, cost bucket, and markup to match your strategy, with projected impact before you go live.

  • Generate best grids — uncover the labor curve and parts markup grid aligned to your goal
  • Tune your way — adjust billed-hour rates, cost buckets, and markups without a black box
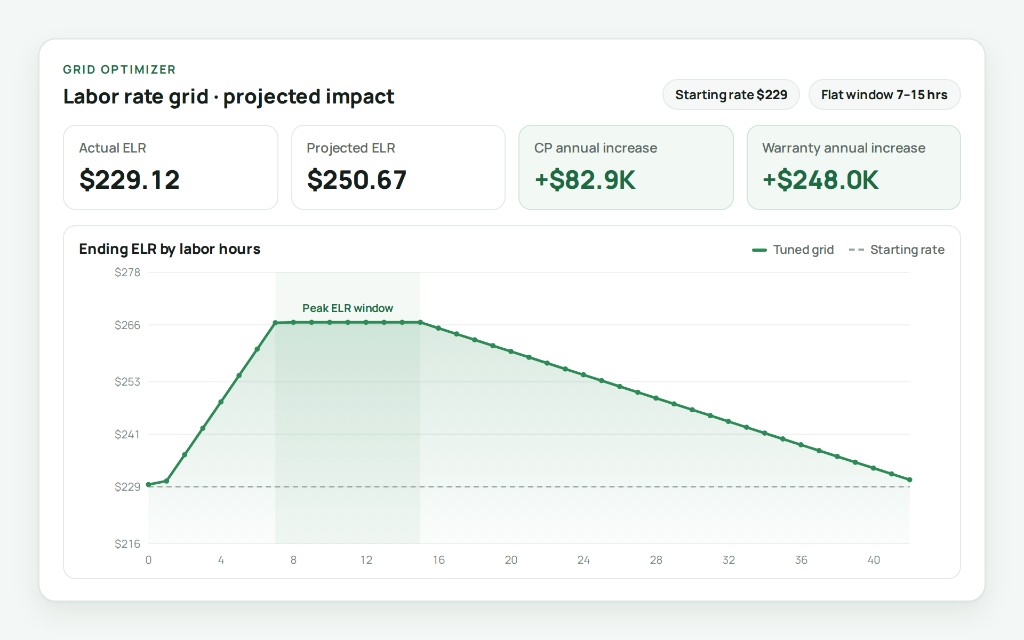
  • See the impact — estimated ELR, parts markup, and projected customer-pay and warranty revenue
  • Protect retention — optimize for uplift without a blunt hit to customer experience
+$1.44M projected uplift, one rooftop +$511K CP labor · +$723K warranty · +$209K CP parts
Run It on Your Numbers
Labor rate matrix calculator with projected ELR and ending ELR graph

See Where Advisors Misalign With Targets

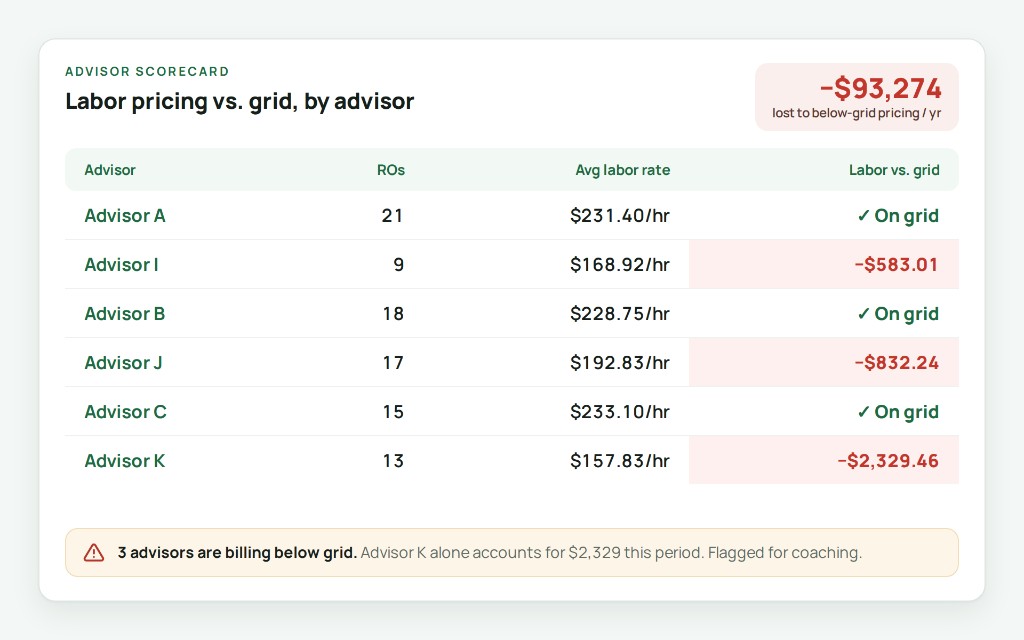
Measure every advisor. Find leaks. Coach with numbers — labor sold, hours, rates, discounts, and variances against grid in one view.

  • Measure every advisor — labor, rates, discounts, and grid variance in one scorecard
  • Find the leaks — who bills below grid and who discounts most, in dollars
  • Get alerted & coach — spot who needs improvement with real data and clear actions
  • Separate people from process when the same pattern shows up store-wide
−$93,274 lost to below-grid pricing / year (one store)
See Advisor Insights
Advisor scorecard with labor metrics and comparison chart

Catch Leaks Before ROs Close

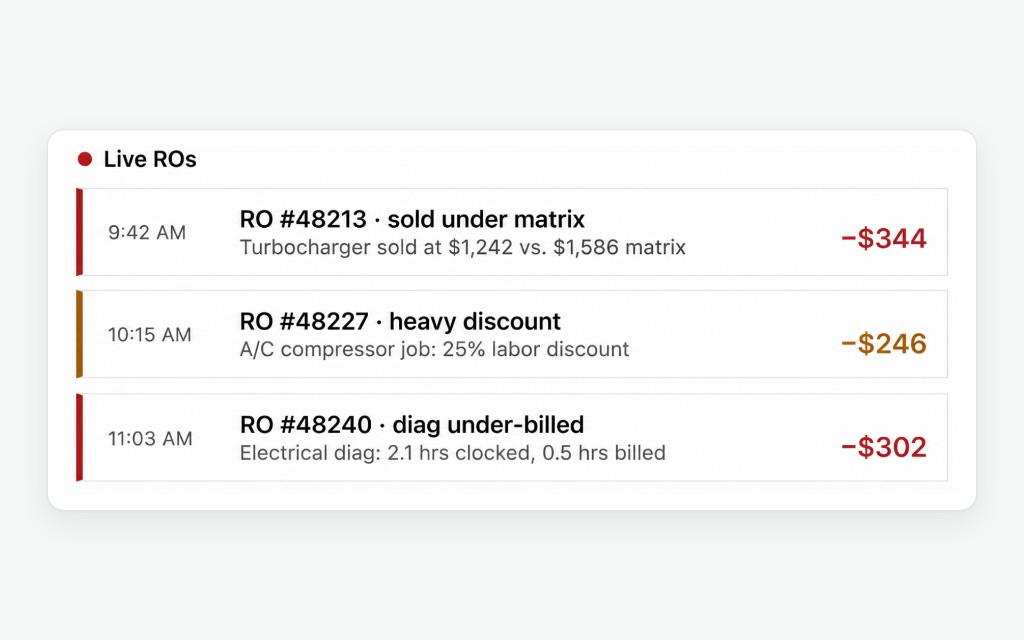
Real-time alerts on under-selling and heavy discounts. Monitor every RO as it flows through the shop — so margin and ELR don’t leak at close.

  • ELR protection — see which ROs are deviating from your grid targets
  • RO-level analytics — labor and parts performance on every repair order
  • Store & group visibility — drill from the group dashboard down to any single RO
  • Live loss prevention — stop leaks while the RO is still open
See Live Monitoring
Live RO monitoring feed showing under-matrix and discount alerts

Get Paid the Warranty Rate You Deserve

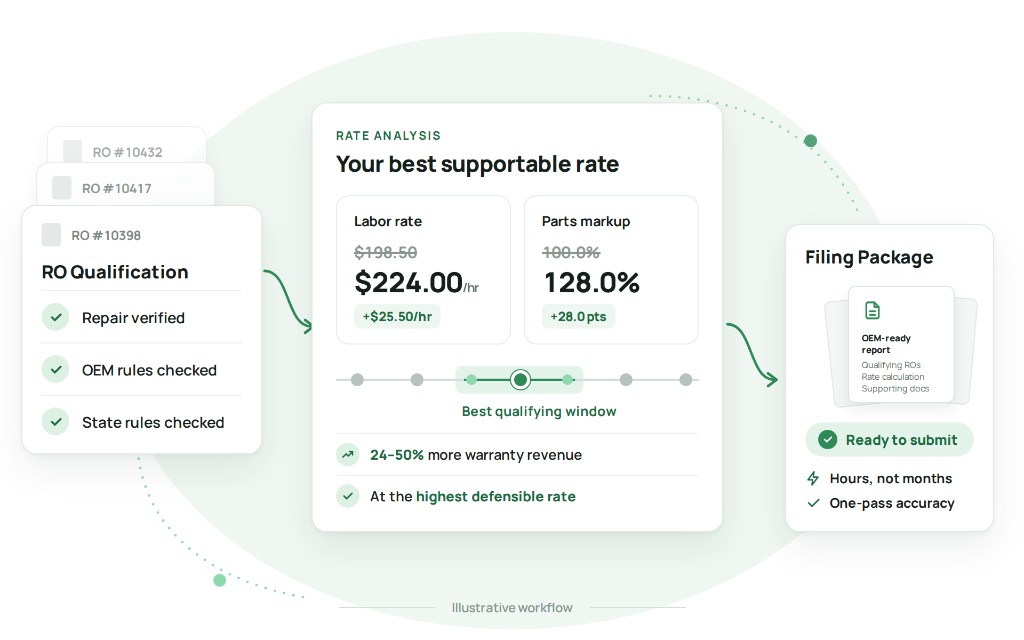
Find your best supportable rates. File it right, and fast — optimal reimbursement windows, approval-ready filing, and execution measured in hours instead of months.

  • Optimal reimbursement rate — 24–50% increase in warranty revenue at the highest defensible rate
  • One-pass filing accuracy — approval-ready filing with fewer rebuttals
  • 90× faster execution — from analysis to submission vs filing manually
  • Results depend on OEM, state, and RO history — we run the review on your numbers
$700K+ average annual warranty increase 90× faster than manual
Book a Warranty Review
Warranty rate increase workflow from RO qualification to filing package

Get the Claim Right While the RO Is Still Open

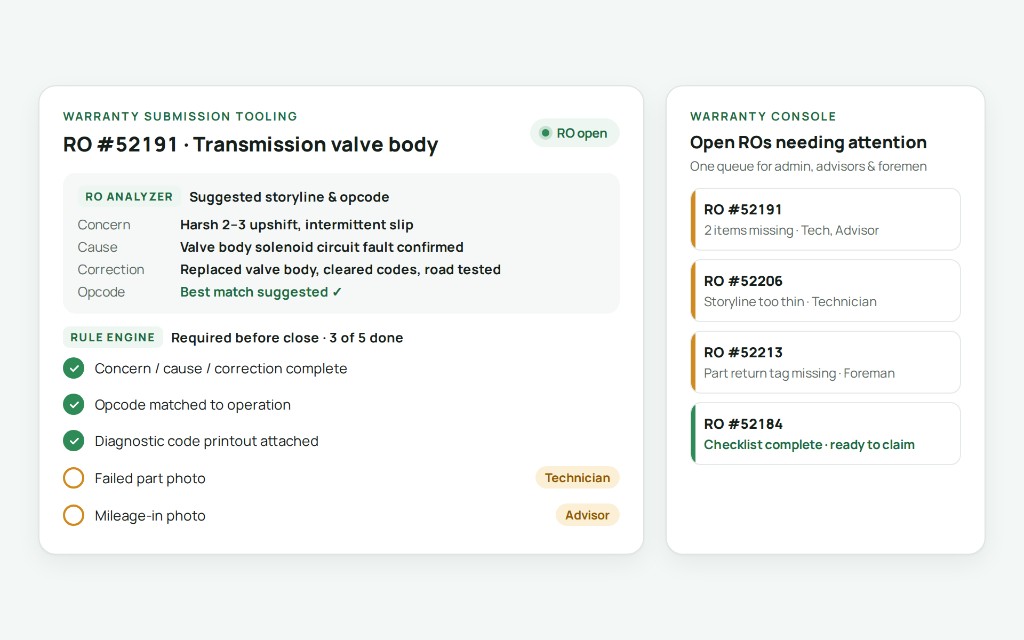
Most claim pain isn’t at filing — it’s the scramble afterward. Missing photos. Thin storylines. Wrong opcodes. Warranty admins chasing advisors, foremen, and technicians for details that should have been captured on the floor. Loopra closes that gap in real time.

  • Surface documentation gaps while the RO is still open — when the tech and advisor can still fix them
  • Recommend the best concern, cause, and correction from the RO’s real context — not a blank form
  • Suggest the best-matching opcode for the operation so coding errors don’t land on the warranty desk
  • Make every required document and checklist item visible before close — less backfill, fewer fire drills
  • Give warranty admin, advisors, foremen, and technicians one shared source of truth — so claims stop bouncing between people
Capture while open Less admin backfill Shop-floor aligned
See Claim Tooling
Warranty submission tooling with RO analyzer, rule engine, and warranty console

From Open RO to Submission-Ready — Without the Chase

Warranty Console keeps the queue honest. RO Analyzer writes the story with the shop. The rule engine makes OEM expectations impossible to miss.

Warranty Console

The shared workbench for warranty admin and the shop. See which open jobs still need documentation, who’s blocked, and what must be finished before the RO closes — not days later in a rebuttal email.

  • Live attention on incomplete claim checklists
  • One queue for admin, advisors, and foremen
  • Stop the post-close scramble before it starts

RO Analyzer

AI that sits with the job while it’s still live. It reads the RO context and recommends the strongest concern, cause, and correction — plus the opcode that best matches the work actually performed.

  • Context-aware concern / cause / correction guidance
  • Best-matching opcode suggestions for the operation
  • Fewer coding and storyline errors reaching warranty admin

Warranty Rule Engine

Turn OEM and store policy into a living checklist the whole team can follow. Photos, punches, parts tags, CCR language — required items are clear while people who can still act are on the job.

  • Every required document surfaced before close
  • Rules extracted from policy — editable by your team
  • Same standard for admin, advisor, foreman, and tech

Outcomes Dealers Measure in Dollars

Figures from real Loopra conversations and customer rooftops. Results vary by dealership, OEM, and state.

$1M+
Annual revenue uplift potential from grid + ops execution
$700K+
Average annual warranty rate increase
$5M+
Warranty opportunity identified across a dealer group
90×
Faster warranty filing — hours, not months

Ask a Question. Get the Fix — and What It’s Worth.

A free, 20-minute review of your store’s performance on your own repair orders.